According to data acquired by the BBC, roads in Great Britain have played host to 2,396,750 crashes from 1999 to 2010. The Beeb then took that data and plotted every single one of them on a map, represented by a point of light. The resulting graphic looks like a picture from the Hubble Telescope, with major and minor clusters of fender-bender-filled galaxies.
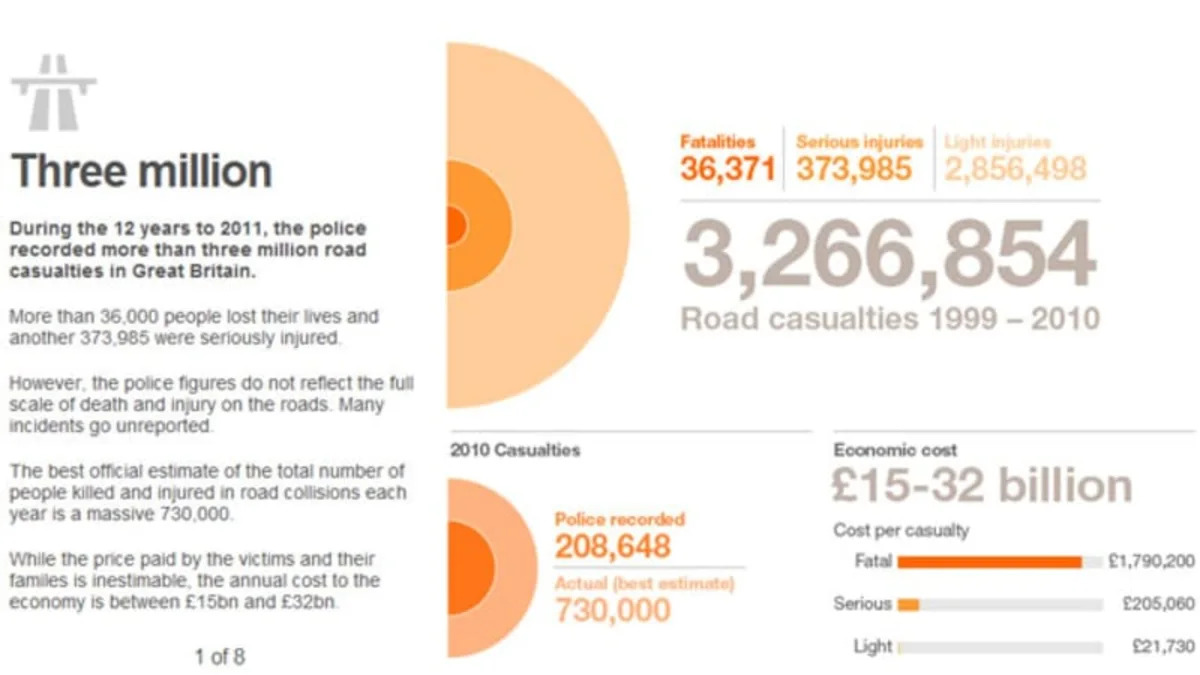
The BBC compiled a large amount of information to go with it, including an in-depth breakdown of the numbers: in those 12 years, more than 36,000 dead – 1,850, or five a day, in 2010 – more than three million injured and more than £15 billion in economic cost.
It goes even further than that, with extra features on things like crash-proof cars, a full day of tweeting from two BBC reporters who spend a day with a London ambulance crew, and time-laps video of when and where accidents happen. So, for any Britons who want to see where and how people are getting hurt on the roads, or for those of you who are just interested in such things, follow the link.

Sign in to post
Please sign in to leave a comment.
Continue