Time for a bit of a math lesson. The amount of fuel consumed by vehicle is determined by dividing the number of miles driven by the miles per gallon. With the mileage being in the denominator, as it grows at a linear pace, the overall result gets progressively smaller. This is what's known as a geometric series. One last example: imagine you have a pie that represents the amount of fuel you use to drive a certain distance at a given mileage. Continue reading after the jump to find out what happens to the pie.
Slice the pie in half. Half of the pie represents the fuel used if you double the mileage. At first, each cut is a big deal. You can go from one pie to half a pie by doubling the mpg. But now cut the pie again and again. As you keep going, the difference in the size of the slices gets smaller and smaller. It also gets progressively more difficult to slice the pie. Similarly, improving the efficiency of a car gets more and more difficult. The cost of increasing efficiency rapidly outweighs the savings – both financially and in terms of its effect on the environment – particularly if you are looking for a larger vehicle.
In the United States, where larger vehicles have long been the rule, the benefits of hypermiling a Prius to get from 50 to 60 mpg may be personally satisfying to the individual driver, but in the grand scheme of things, it will have almost no measurable impact. On the other hand, smaller improvements to vehicles that get mileage in the teens and even twenties has a much bigger impact. Another way to understand this phenomenon is to think in terms of gallons per mile (GPM) instead of miles per gallon.
An improvement from 12 to 15 mpg yields a fuel consumption reduction of 200 gallons per year over 12,000 miles. Even going from 21 to 24 mpg saves 71.4 gallons annually. By comparison that 10 mpg increase from 50 to 60 mpg only saves about 35 gallons. That's why, when General Motors introduced its two mode hybrid system, it went for the big bang for buck by applying it to full-size SUVs and pickups. In retrospect, as big truck sales collapsed in 2007-8, the demand for the hybrid versions was too limited. Still, similar reasoning explains why Ford is introducing it's EcoBoost direct injected turbocharged engines starting with the new 3.5-liter V6.
The same phenomena is part of the reasoning behind cash for clunkers. Taking older, lower mileage cars off the and replacing them with vehicles that only get 8-10 mpg more can have a much bigger impact than replacing a 35 mpg car with one that gets 45 mpg. Of course, there are other issues with the specific implementation of cash for clunkers in the U.S., but that's another story. The really important thing in the near term is to make improvements to high volume, high consumption vehicles.
If two million vehicles that currently get 15 mpg were improved to 24 mpg, that would save 267 million gallons of gasoline annually. The American Petroleum Institute estimates that each 42 gallon barrel of crude yielded 19.4 gallons of refined gasoline. That would amount to savings of 13.7 million barrels a year. A similar 9 mpg improvement from 33 to 42 mpg would only save 4.9 million barrels a year. With an additional 2 million new vehicles displacing older vehicles every year, the savings would be compounded. It's certainly important to improve as many vehicles as possible, but with limited resources, the poorest vehicles deserve the biggest efforts. Now, who's got a bit of pie for me?
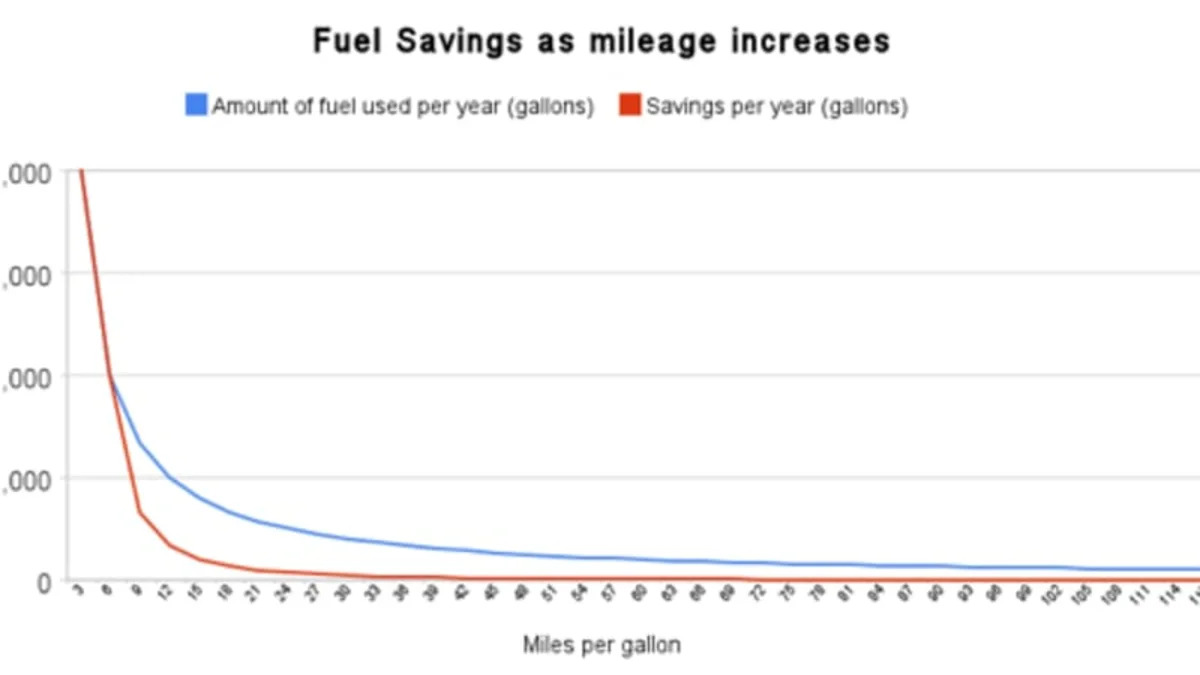
| Mileage (MPG) | Amount of fuel used per year (gallons), 12,000 miles | Savings per year (gallons), 12,000 miles | |
| 3 | 4,000.00 | 4,000.00 | |
| 6 | 2,000.00 | 2,000.00 | |
| 9 | 1,333.33 | 666.67 | |
| 12 | 1,000.00 | 333.33 | |
| 15 | 800.00 | 200.00 | |
| 18 | 666.67 | 133.33 | |
| 21 | 571.43 | 95.24 | |
| 24 | 500.00 | 71.43 | |
| 27 | 444.44 | 55.56 | |
| 30 | 400.00 | 44.44 | |
| 33 | 363.64 | 36.36 | |
| 36 | 333.33 | 30.30 | |
| 39 | 307.69 | 25.64 | |
| 42 | 285.71 | 21.98 | |
| 45 | 266.67 | 19.05 | |
| 48 | 250.00 | 16.67 | |
| 51 | 235.29 | 14.71 | |
| 54 | 222.22 | 13.07 | |
| 57 | 210.53 | 11.70 | |
| 60 | 200.00 | 10.53 | |
| 63 | 190.48 | 9.52 | |
| 66 | 181.82 | 8.66 | |
| 69 | 173.91 | 7.91 | |
| 72 | 166.67 | 7.25 | |
| 75 | 160.00 | 6.67 | |
| 78 | 153.85 | 6.15 | |
| 81 | 148.15 | 5.70 | |
| 84 | 142.86 | 5.29 | |
| 87 | 137.93 | 4.93 | |
| 90 | 133.33 | 4.60 | |
| 93 | 129.03 | 4.30 | |
| 96 | 125.00 | 4.03 | |
| 99 | 121.21 | 3.79 | |
| 102 | 117.65 | 3.57 | |
| 105 | 114.29 | 3.36 | |
| 108 | 111.11 | 3.17 | |
| 111 | 108.11 | 3.00 | |
| 114 | 105.26 | 2.84 | |
| 117 | 102.56 | 2.70 | |
| 120 | 100.00 | 2.56 | |

Sign in to post
Please sign in to leave a comment.
Continue