Top Ten Worst Cities For Drivers
The vast majority of Americans -- approximately 250 million -- live in or around a city. That means most of you know how frustrating it can be to putter along traffic-choked roads and sit in endless delays.
And traffic doesn’t only cost time. Drivers lose money idling away their gasoline.
There are a number of studies that analyze exactly how much time and gas drivers fritter away. When you combine the two factors, and add in a look at overall population density, you can get a more complete, city-by-city look at the worst overall cities to operate a car.
The folks at NerdWallet.com did just that. Using data from a study done by the Texas Transportation Institute on the annual hours commuters spend in traffic delays, gas price data from 304 different urban areas compared to the national average and census information on population density to give the 50 largest metropolitan areas a final score.
The lower the overall score, the worse for the city's drivers. Here's a look at their 10 worst cities, and here’s hoping you’re not on the roads of these cities today:
Image Credit: Joe Shlabotnik, Flickr

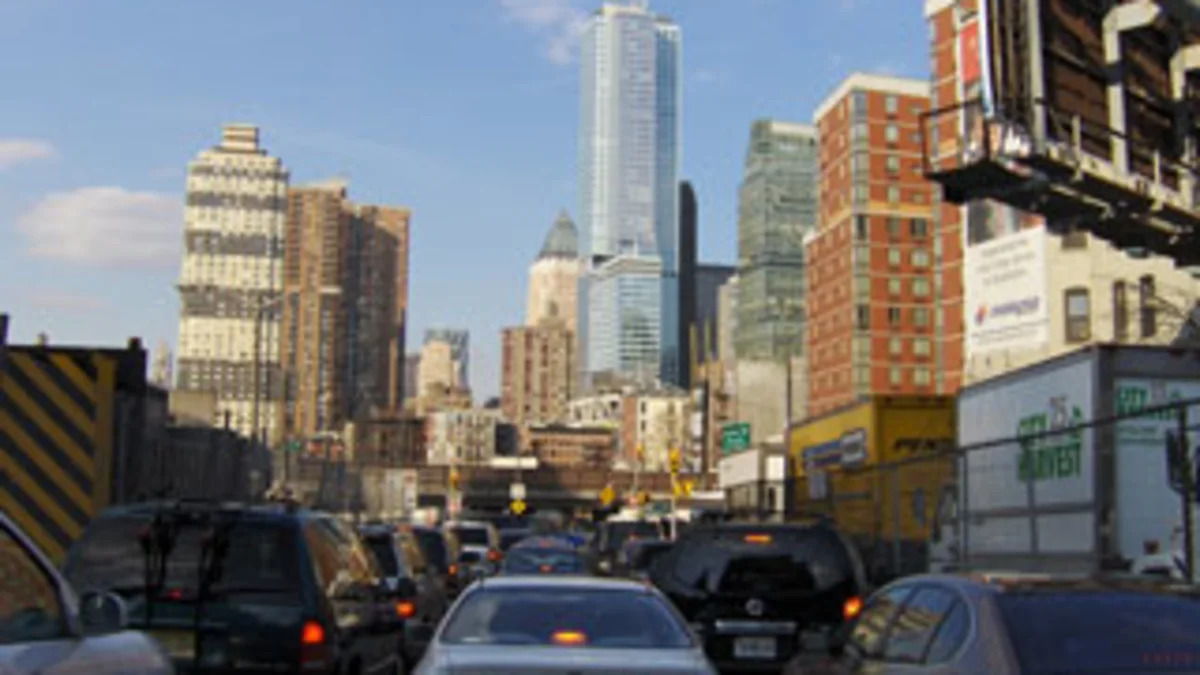
10. Philadelphia, PA
Annual hours of delay per commuter: 48
% Difference between cost of a gallon of gas and national urban average: -2.71%
Population density (people per square mile): 11,379.5
Overall score for car owners: 58.2
Image Credit: dennis, Flickr
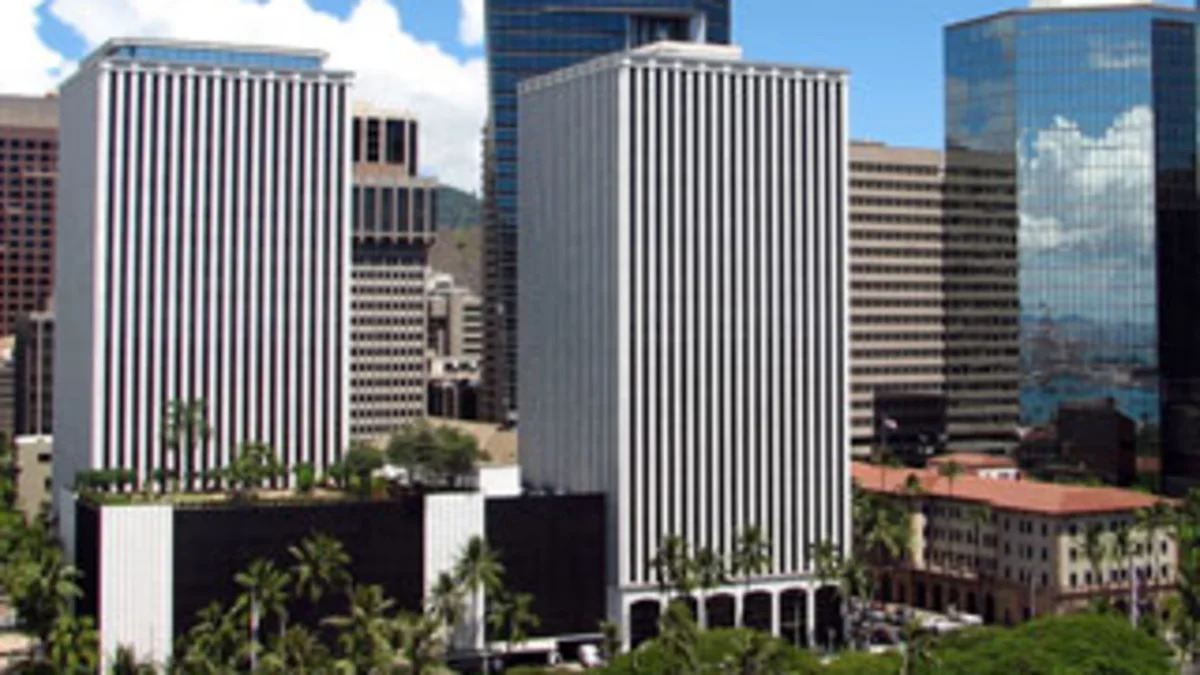
8. Honolulu, HI
Annual hours of delay per commuter: 45
% Difference between cost of a gallon of gas and national urban average: +17.28%
Population density (people per square mile): 5,572.6
Overall score for car owners: 51.3
Image Credit: lrargerich, Flickr

6. Washington, DC
Annual hours of delay per commuter: 67
% Difference between cost of a gallon of gas and national urban average: -3.07%
Population density (people per square mile): 9,856.5
Overall score for car owners: 48.9
Image Credit: dherman1145, Flickr

4. Los Angeles, CA
Annual hours of delay per commuter: 61
% Difference between cost of a gallon of gas and national urban average: +7.24%
Population density (people per square mile): 8,092.3
Overall score for car owners: 46.5
Image Credit: RodneyRamsey, Flickr

2. Chicago, IL
Annual hours of delay per commuter: 51
% Difference between cost of a gallon of gas and national urban average: +30.30%
Population density (people per square mile): 11,841.8
Overall score for car owners: 29.1
Image Credit: grendelkhan, Flickr