
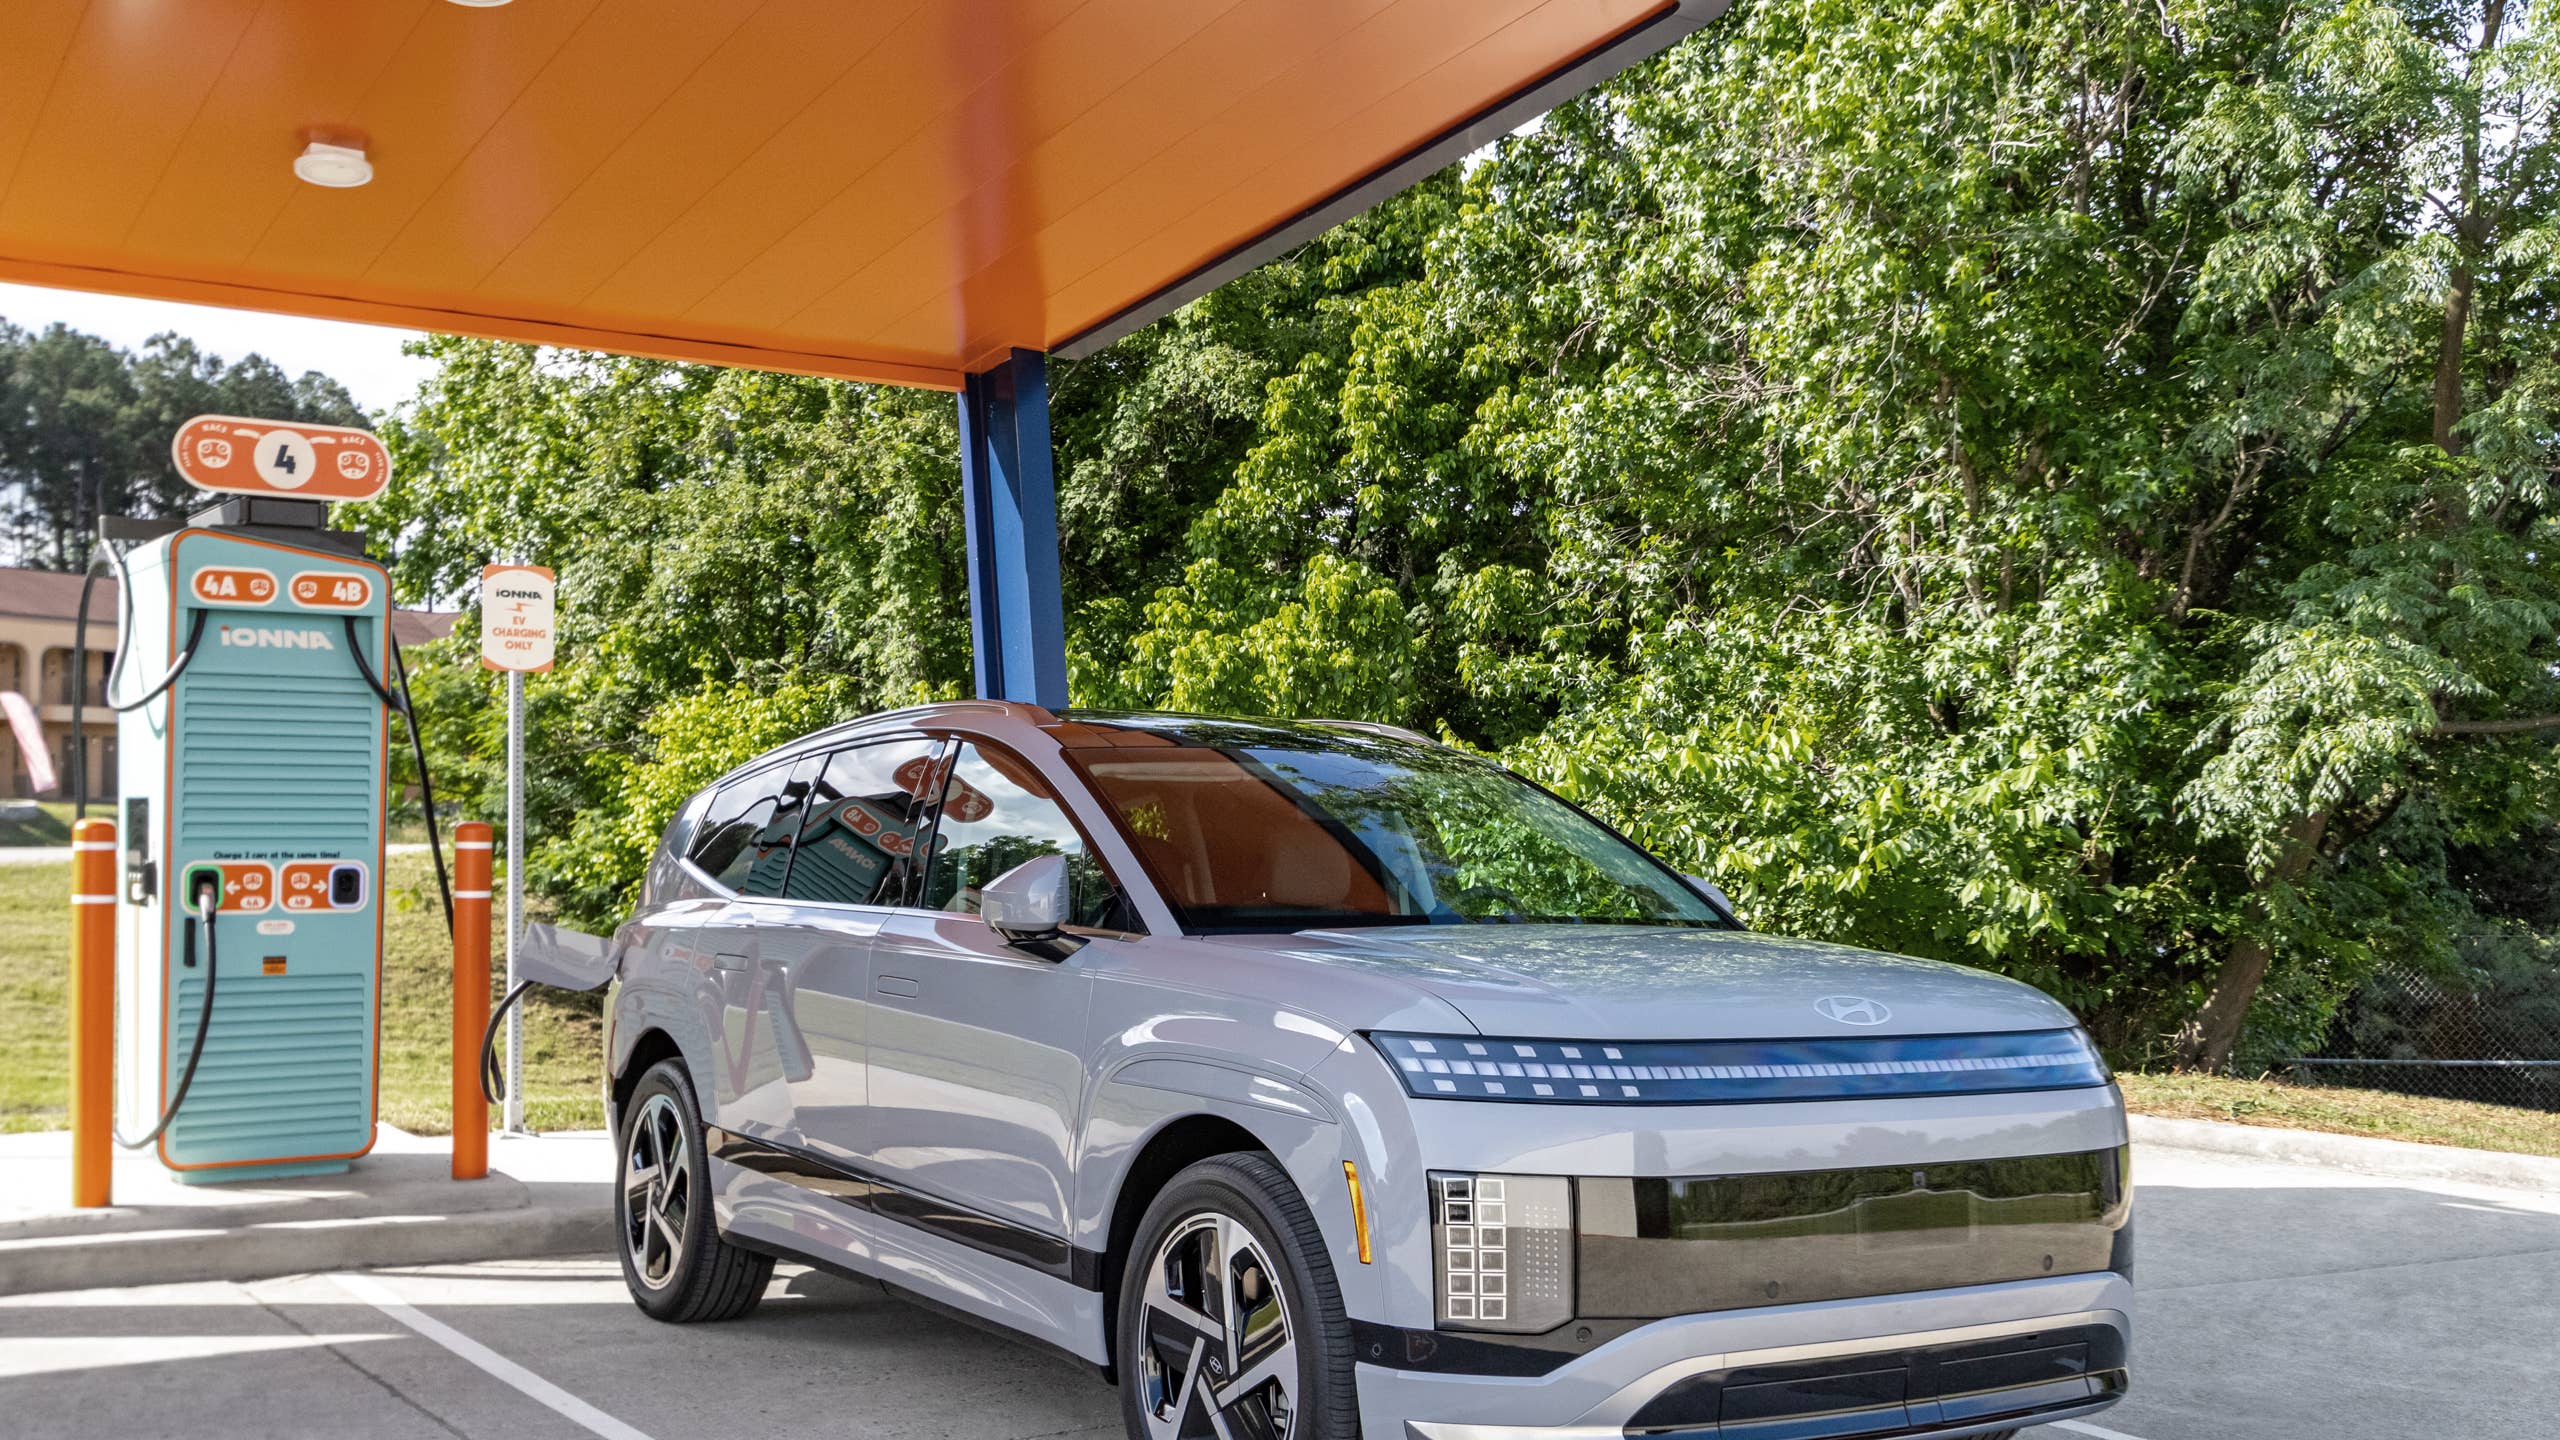
America’s public EV charging network is still growing, but far more slowly than it used to. Charger growth is projected at 15.5% this year, down from 25.7% in 2025, according to a new iSeeCars analysis of data from the U.S. Department of Energy’s Alternative Fuels Data Center.
Access already varies widely. In the best-served metro area, there are about 334 residents for each charger. In the worst, that number climbs to 2,904.
The Network Is Growing, Just Not as Fast
The study counts individual Level 2 and DC fast charging ports. By that measure, the U.S. is projected to add 40,243 chargers this year, bringing the total to 299,798, according to the iSeeCars study. The national ratio is projected to improve from 1,317 residents per charger in 2025 to 1,143 in 2026. Annual growth held above 30% for most of the past decade.
Fast chargers alone show a similar trend. Charging data firm Paren, which tracks only DC fast charging, reports that new fast-charging ports installed through the first three quarters of 2026 are running about 9% behind last year’s pace, and new stations about 20% behind, even as fast-charging sessions rose 26% year over year in the third quarter. The U.S. now has 80,964 DC fast ports.

Zac Palmer
Drivers are also outpacing plugs. The Alliance for Automotive Innovation counts about 7.5 million EVs on U.S. roads and roughly 31 EVs per public charging port as of the first quarter of 2026.
Federal support has thinned at the same time. The National Electric Vehicle Infrastructure program, which set aside billions for highway fast chargers, was frozen and challenged in court in 2025. In February 2026, Congress passed a spending law that redirected roughly $879 million in previously approved EV charging infrastructure funds to other uses. No study directly ties the broader slowdown to these funding changes, but they add uncertainty for companies deciding where and when to build.
The Best and Worst States
Vermont ranks first with 450 residents per charger, while Louisiana ranks last at 4,717, more than ten times as many. California dominates on volume, with 81,932 chargers, more than a quarter of the national total.
| Rank | Most EV-Friendly | Residents per Charger | Least EV-Friendly | Residents per Charger |
| 1 | Vermont | 450 | Louisiana | 4,717 |
| 2 | California | 480 | Mississippi | 3,541 |
| 3 | Massachusetts | 539 | Kentucky | 3,270 |
| 4 | Colorado | 651 | Alaska | 3,254 |
| 5 | Connecticut | 677 | West Virginia | 2,942 |
| 6 | Washington | 763 | North Dakota | 2,776 |
| 7 | Maine | 793 | South Dakota | 2,710 |
| 8 | New York | 816 | Indiana | 2,623 |
| 9 | Oregon | 894 | Arkansas | 2,572 |
| 10 | Maryland | 981 | Nebraska | 2,398 |
| National average | 1,143 |
Source: iSeeCars, based on Department of Energy data through September 2026. 2026 figures are projected.
Residents per charger is a rough measure. It does not capture how busy stations are, how fast they charge or how far apart they sit, but it is a useful way to compare regions. The states that trail are mostly not catching up. North Dakota shows no improvement over last year, and Wyoming improved just 2.8%. New Jersey and Washington lead with gains of more than 22%.
The Best and Worst Metro Areas
San Francisco-Oakland-San Jose leads the 50 largest metro areas with 334 residents per charger, followed by San Diego at 432 and Los Angeles at 500. Los Angeles has the most chargers of any metro, at 36,318.
Louisville sits at the bottom with 2,904 residents per charger, followed by Indianapolis, Milwaukee, Greensboro-Winston Salem and San Antonio. Minneapolis-St. Paul is improving fastest, with residents per charger down 22.5%.
Reliability Is Better, but Not Fixed
A nearby charger is only useful if it works. In J.D. Power’s 2026 EVX Public Charging Study, 12% of visits to public chargers ended without a charge in the most recent quarter, roughly one in eight. That is the lowest rate in the study’s history, down from 14% a year earlier.
J.D. Power says public charging is the top reason new-vehicle shoppers reject EVs.
Satisfaction with DC fast charging rose 12 points to 666 on a 1,000-point scale, while satisfaction with slower Level 2 public chargers fell 12 points to 595. Ionna, the fast-charging network backed by a group of automakers, ranked highest at 807, followed by the Mercedes-Benz Charging Network and the Rivian Adventure Network.
Owners were most satisfied with fast chargers at hotels, gas stations and restaurants, and least satisfied with those at dealerships.
Tesla’s Network Is Now Open to Most Brands
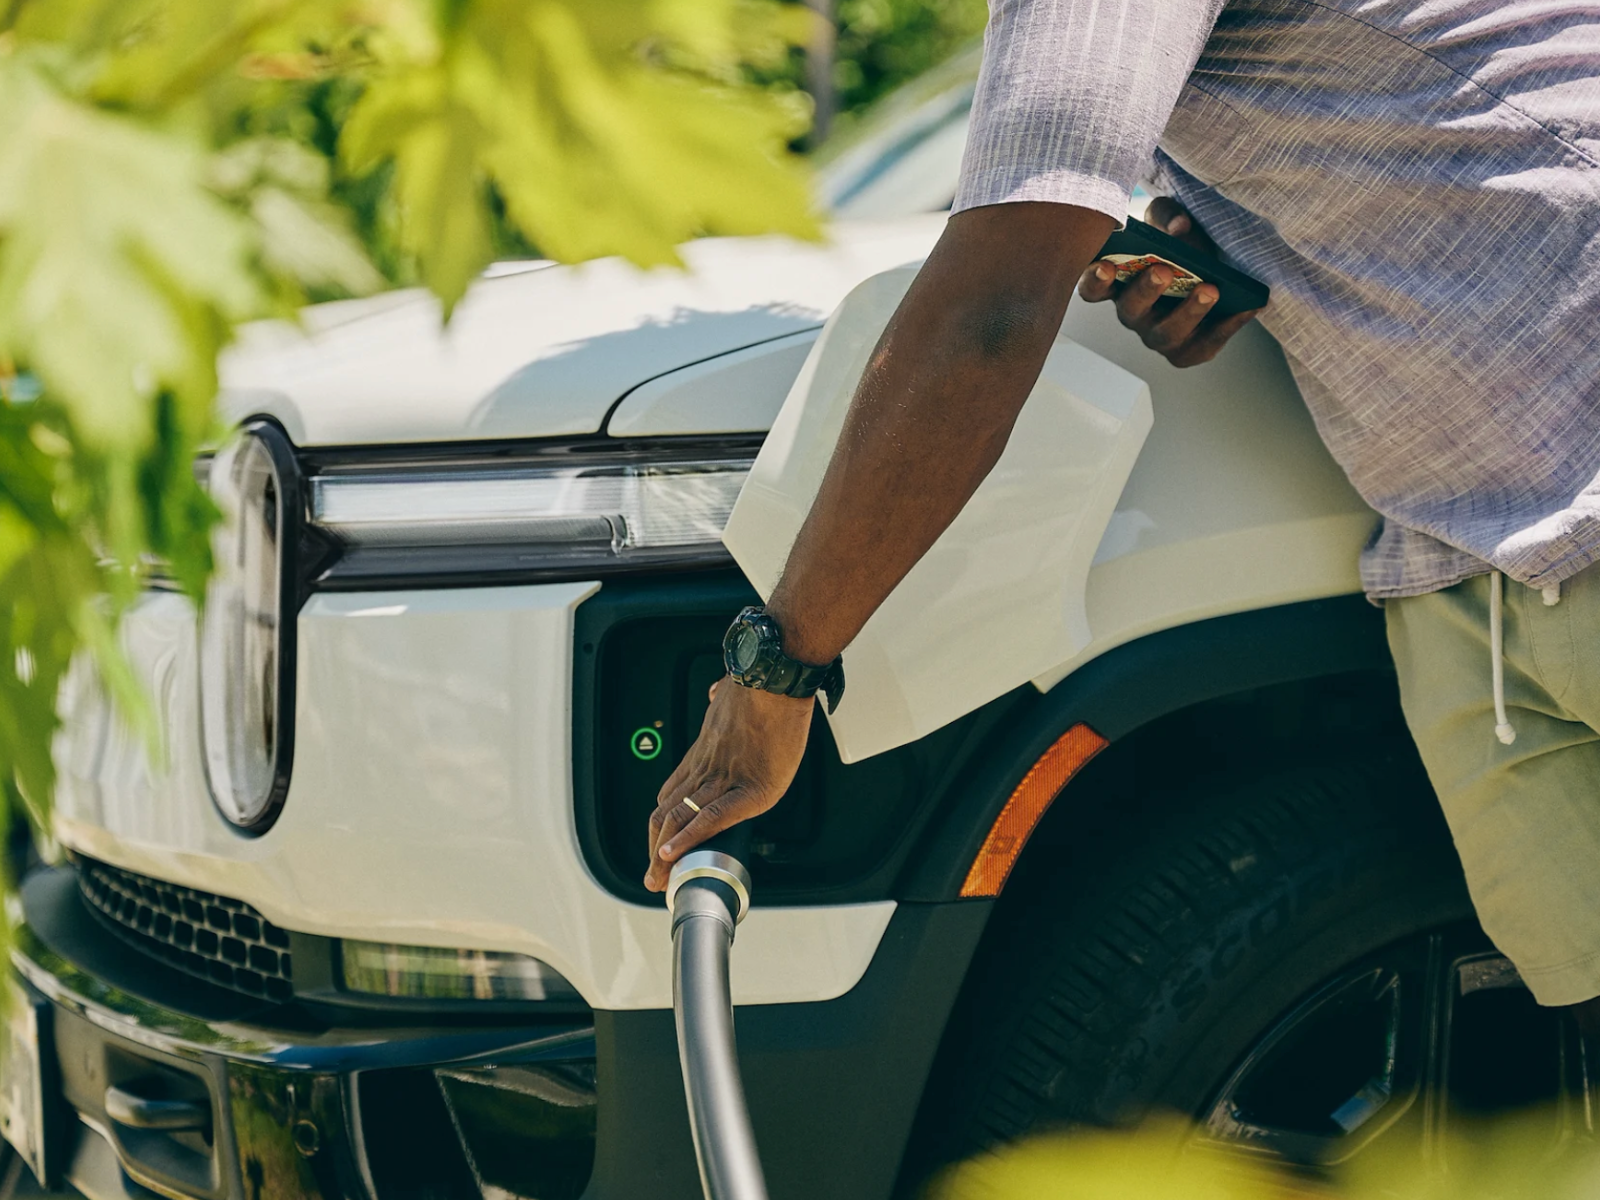
The shift to Tesla’s NACS plug has made the Supercharger network far more useful for non-Tesla owners. Many major brands now have access to Superchargers, either with an adapter or through a native port on newer models such as the 2025 and later Hyundai Ioniq 5 and Kia EV6 and the 2026 Toyota bZ. Access and adapter needs vary by model year, so it is worth checking your specific vehicle.
Tesla accounts for roughly half of all U.S. DC fast charging ports, according to Paren, so Supercharger access can make a big difference for non-Tesla owners.
What Charging Actually Costs
Where you charge makes a bigger difference than ever. For an EV that averages 3.5 miles per kWh and a gas car that gets 30 mpg, here is what 250 miles costs at current prices:
| How You Fuel | Cost for 250 Miles | Cost per Mile |
| Home charging (18.2 cents/kWh) | About $13 | 5.2 cents |
| Gasoline ($4.30/gallon) | About $36 | 14.3 cents |
| Average DC fast charger (54 cents/kWh) | About $39 | 15.4 cents |
Home rate based on the EIA’s August 2026 average residential price of 18.16 cents per kWh. DC fast price is Paren’s Q3 2026 national average. Gas price is the AAA national average on Oct. 24, 2026. Figures exclude charging losses.
At today’s prices, relying on public fast charging can cost slightly more than filling up with gas. Charging at home costs about a third as much.
Home electricity rates vary widely by state, too. At August rates, adding 250 miles at home costs about $9 in Louisiana, which has some of the cheapest residential power in the country but the worst charger access in the iSeeCars ranking. The same charge costs about $21 in California.
A home Level 2 setup typically runs $1,000 to $2,600 including hardware and installation, according to installer Qmerit, and a panel upgrade can add $1,500 to $3,000. The federal tax credit for home chargers ended for equipment installed after June 30, 2026.
What to Check Before You Buy
iSeeCars executive analyst Karl Brauer says local charging access “should be a primary consideration” for EV shoppers. A few practical steps:
- Search your ZIP code. The Department of Energy’s station locator shows nearby public chargers and whether they are Level 2 or DC fast.
- Price out home charging. If you can charge at home, public charger density matters far less, and you pay far less per mile.
- Check Supercharger access for your model. Confirm whether it has a native NACS port or needs an adapter.
- Map your regular routes. State and metro averages can hide long gaps between towns.
Cadillac
About the author

Adam Lynton
Co-Editor-in-Chief, Autoblog