
The increase in the rate of 2020 motor vehicle deaths in the U.S. was the largest since 1924, according to a report from the National Safety Council (NSC). More than 42,000 people are estimated to have died on U.S. roadways last year, the largest motor vehicle death tally in 13 years.
The NSC estimates that in 2020:
- 42,060 people died in crashes, eclipsing 2019’s estimate of 39,107 — an 8% increase.
- Yet vehicle miles traveled fell 13% compared to 2019, from 3.26 trillion to 2.83 trillion.
- The mileage death rate was 1.49 deaths per 100 million miles traveled, up 24% from 1.20 in 2019.
- The annual population death rate was 12.8 deaths per 100,000 people, up from 11.9 in 2019.
- The NSC also said car crashes caused 4.8 million injuries requiring medical treatment. The injury-to-death ratio was 114:1.
- The estimated cost of deaths, injuries, and property damage to American society in 2020 was $474.4 billion.
The nonprofit did not offer any specific explanation why deaths increased despite fewer miles traveled, but local agencies have blamed the pandemic for an upward trend in speeding infractions and traffic fatalities beginning in the second quarter of 2020.
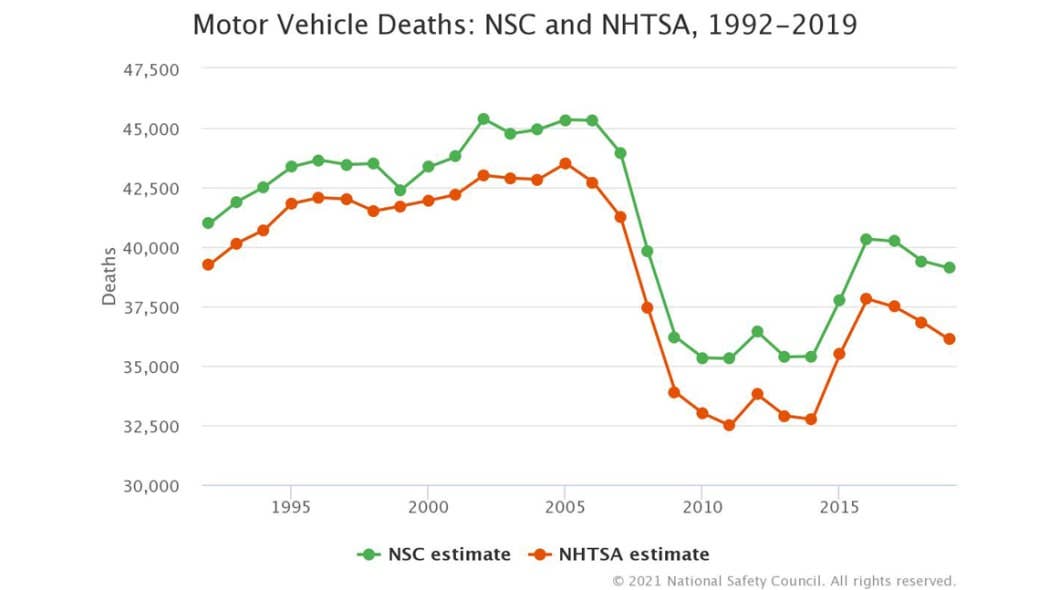
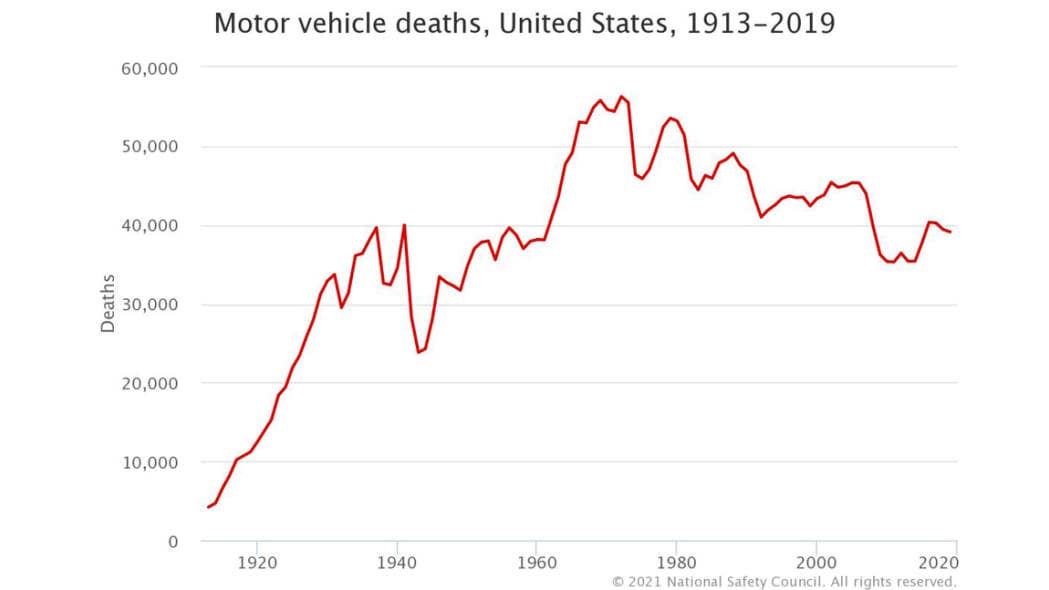
NSC’s reported fatality totals are higher than those suggested by the National Highway Traffic Safety Administration (NHTSA) for two reasons. For starters, NSC includes deaths that happen on private roads (including parking lots and driveways), whereas NHTSA only reports fatalities that occur on public roads and highways. NHTSA also excludes any deaths that occur more than 30 days following the precipitating accident, allowing the agency to “close the books” and file a final report eight months after the close of the calendar year in question; NSC, on the other hand, tracks deaths on a rolling, 12-month basis to eliminate the need for such a sharp cutoff. The gulf between the Council’s estimates and the government’s is therefore between 1,700 and 2,900 per year, on average. As you can see in the above chart, while the totals are different, the trends are virtually identical.
“It is tragic that in the U.S., we took cars off the roads and didn’t reap any safety benefits,” said NSC President and CEO Lorraine M. Martin. “These data expose our lack of an effective roadway safety culture. It is past time to address roadway safety holistically and effectively, and NSC stands ready to assist all stakeholders, including the federal government.”
The NSC says that only nine states saw a decline in road fatalities:
- Alaska (-3%)
- Delaware (-11%)
- Hawaii (-20%)
- Idaho (-7%)
- Maine (-1%)
- Nebraska (-9%)
- New Mexico (-4%)
- North Dakota (-1%)
- Wyoming (-13%)
Meanwhile, seven states and the District of Columbia saw large swings (> 15%) in the other direction:
- Arkansas (+26%)
- Connecticut (+22%)
- District of Columbia (+33%)
- Georgia (+18%)
- Mississippi (+19%)
- Rhode Island (+26%)
- South Dakota (+33%)
- Vermont (+32%)