
Nearly 4 million Americans have “extreme” commutes to work, according to a new study.
Approximately 1.7 million people spend more than 90 minutes commuting each way, and approximately 2.2 million workers travel at least 50 miles in each direction. Either qualify as “extreme,” according to the Census Bureau, which authored the study.
Then there are those poor souls who do both – about 600,000 Americans who spend more than 90 minutes traveling at least 50 miles in one direction. They are “megacommuters,” the study says.
They make up less than 1 percent of the U.S. workforce.
Three quarters of megacommuters are male. They are likely to be older, married, make a higher-than-average salary and depart for work before 6 a.m., and live in San Francisco, Washington D.C., Los Angeles or New Jersey.
Data for the study was culled from the American Community Survey, a nationwide survey designed as part of the census that provides demographic, social, economic and housing information.
Some other notable highlights that emerged on American commuters:
– The average commute for a U.S. citizen is 25.5 minutes.
– Approximately 8.1 percent of Americans had commutes of 60 minutes or more. On the flipside, 13.4 percent of Americans who work outside the home traveled less than 10 minutes to their job.
– Between 1997 and 2010, the number of Americans who work from home has increased 45 percent, from 9.2 million to 13.4 million.
– Of those with commutes of 60 minutes or more, 23 percent of commuters use public transportation compared with 5.4 percent of all workers.
Pete Bigelow is an associate editor at AOL Autos. He can be reached via email at peter.bigelow@teamaol.com and followed on Twitter @PeterCBigelow.
Featured Gallery
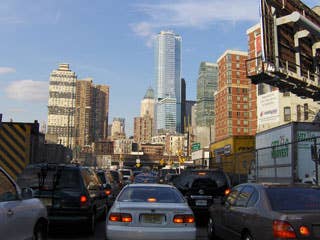
The vast majority of Americans — approximately 250 million — live in or around a city. That means most of you know how frustrating it can be to putter along traffic-choked roads and sit in endless delays.
And traffic doesn’t only cost time. Drivers lose money idling away their gasoline.
There are a number of studies that analyze exactly how much time and gas drivers fritter away. When you combine the two factors, and add in a look at overall population density, you can get a more complete, city-by-city look at the worst overall cities to operate a car.
The folks atNerdWallet.com did just that. Using data from a study done by the Texas Transportation Institute on the annual hours commuters spend in traffic delays, gas price data from 304 different urban areas compared to the national average and census information on population density to give the 50 largest metropolitan areas a final score.
The lower the overall score, the worse for the city’s drivers. Here’s a look at their 10 worst cities, and here’s hoping you’re not on the roads of these cities today:
Image Credit:Joe Shlabotnik, Flickr

Annual hours of delay per commuter: 48
% Difference between cost of a gallon of gas and national urban average: -2.71%
Population density (people per square mile): 11,379.5
Overall score for car owners: 58.2
Image Credit:dennis, Flickr
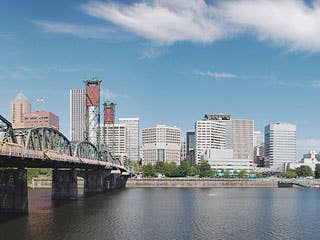
Annual hours of delay per commuter: 44
% Difference between cost of a gallon of gas and national urban average: +15.16%
Population density (people per square mile): 4,375.3
Overall score for car owners: 55.1
Image Credit:Si1very, Flickr
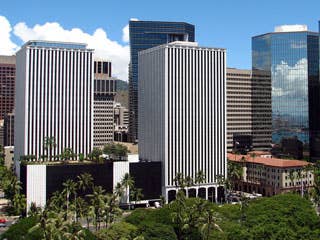
Annual hours of delay per commuter: 45
% Difference between cost of a gallon of gas and national urban average: +17.28%
Population density (people per square mile): 5,572.6
Overall score for car owners: 51.3
Image Credit:lrargerich, Flickr

Annual hours of delay per commuter: 61
% Difference between cost of a gallon of gas and national urban average: +5.38%
Population density (people per square mile): 7,004.0
Overall score for car owners: 49.4
Image Credit:Chris and/or Kevin, Flickr

Annual hours of delay per commuter: 67
% Difference between cost of a gallon of gas and national urban average: -3.07%
Population density (people per square mile): 9,856.5
Overall score for car owners: 48.9
Image Credit:dherman1145, Flickr

Annual hours of delay per commuter: 53
% Difference between cost of a gallon of gas and national urban average: +3.04%
Population density (people per square mile): 12,792.7
Overall score for car owners: 48.7
Image Credit:Willem van Bergen, Flickr

Annual hours of delay per commuter: 61
% Difference between cost of a gallon of gas and national urban average: +7.24%
Population density (people per square mile): 8,092.3
Overall score for car owners: 46.5
Image Credit:RodneyRamsey, Flickr
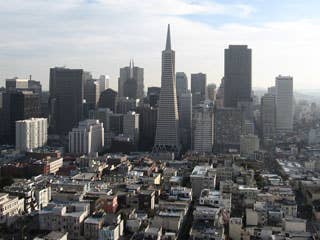
Annual hours of delay per commuter: 61
% Difference between cost of a gallon of gas and national urban average: +5.75%
Population density (people per square mile): 17,179.2
Overall score for car owners: 36.1
Image Credit:moonlightbulb, Flickr
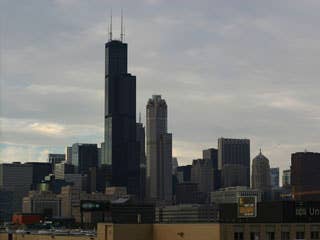
Annual hours of delay per commuter: 51
% Difference between cost of a gallon of gas and national urban average: +30.30%
Population density (people per square mile): 11,841.8
Overall score for car owners: 29.1
Image Credit:grendelkhan, Flickr

Annual hours of delay per commuter: 59
% Difference between cost of a gallon of gas and national urban average: +7.67%
Population density (people per square mile): 27,012.4
Overall score for car owners: 23.2
Image Credit:danielfoster437, Flickr